10. sos Report Plugins
One of the most powerful characteristics of the sos command is that it is extensible. The report functionality of sos operates through a system of plugins, each designed to collect specific types of information like a system component or software product. Each plugin focuses on a different aspect of the Linux system.
These plugins allow sos to capture domain-specific data tailored to particular systems and applications and any can be disabled or enabled. Some of these plugins are not active by default and need to be enabled on the command line.
Each plugin "knows" what logs and configuration files to retrieve and what commands to execute depending on the nature of the plugin. For example, the default process plugin will retrieve the status, cpuset, oom_*, stack, and limits files of each process under the /proc virtual filesystem. It will also execute the ps, lsof, pstree, iotop, and pidstat commands several times with different options to provide a very detailed picture of the state of the processes currently running in the system.
This modular plugin architecture allows the sos command to execute several plugins simultaneously in a multi-threaded fashion with no interference between plugins. sos report latest version (4.11.1) handles more than 400 plugins. Some of the most common ones include kernel, memory, networking, process, lvm2, hardware, systemd, selinux, firewalld, dpkg, sar — just to name a few. A complete and detailed list of plugins with descriptions of what each does can be found in this article
When the sos command is executed, not all available plugins are executed. Some plugins are specific to certain Linux distributions. For example, when using sos on a Debian-like environment the dpkg plugin is used to obtain software packages installed on the server, while in RHEL-like systems the rpm or dnf plugins are required.
As mentioned before, there are many plugins that are used only if enabled from the command line, and usually these are plugins designed for specific open-source products like Docker, Kubernetes, Ansible, Puppet, OpenStack, Ceph, Proxmox, Juju, Grafana and many more. A complete and detailed list of plugins with descriptions of what each does can be found in this article.
When sos report runs, it will first look to see which plugins exist and which of those should be enabled. Only plugins that pass an enablement check for the specific system are executed. A plugin captures unique information for the component or product it is written for (i.e. plugins never collect the same data that another plugin has already collected).
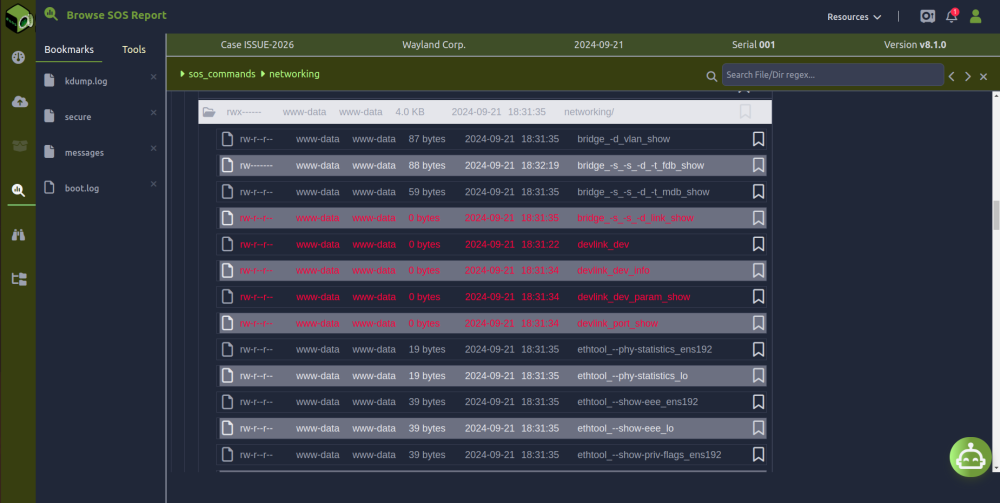
Each plugin writes the output of the domain-specific commands that it executes to a subdirectory under the sos_commands directory. Each subdirectory has the same name as the plugin.
For example, the networking plugin will execute a set of commands that retrieve most network-related aspects including: bridge, devlink, ip, netstat, tc and others if available. Each command may be executed several times with different options in order to retrieve all networking details. The output of each command's execution will be stored under the sos_commands/networking directory as shown in the image above.
Some plugins have their own options to modify their behaviour.
The sos report command includes a plugin called sos_extras designed to collect additional custom or user-specified information during the generation of a sosreport. To learn how to include your own command outputs, logs or configuration files a detail description can be found in this article
Profiles
The sos command also supports profiles. A profile is a way to group several plugins together and helps simplify the invocation of the sos command. sos report latest version (4.11.1) supports 41 different profiles including: ai, ansible, apache, boot, ceph, cifs, cloud, cluster, container, debug, desktop, gpu, hardware, hpc, identity, java, kernel, mail, memory, microshift, network, nfs, observability, openshift, openstack, performance, perl, sap, security, and services. A complete and detailed list of profiles with descriptions of which plugins they include can be found in this article.
Examples
For simplicity, in these examples we omit the case (--case-id), security (--encrypt-pass or --encrypt-key) and automatic upload (--upload-user, --upload-pass, --upload-url and --upload-method) options that should always be used.
To generate a sosreport with the default plugins just execute:
$ sudo sos reportTo generate a sosreport with only the data collected by the process and the memory plugins:
$ sudo sos report --only-plugins process,memoryTo generate a sosreport with the default plugins except the process and memory plugins:
$ sudo sos report --skip-plugins process,memoryTo generate a sosreport with all the default plugins (please note that the networking plugin is included in the default plugins) and enable the traceroute option for the networking plugin (note that this option is not enabled by default):
$ sudo sos report --plugin-option networking.traceroute=onTo generate a sos report with all the default plugins and the nginx plugin with all logs, and the docker plugin with all logs and image sizes for all containers:
$ sudo sos report --enable-plugins nginx,docker -k nginx.log=on -k docker.logs=on -k docker.size=onTo generate a sos report with the default plugins plus the plugins used by the ansible profile (aap_containerized, aap_controller, aap_eda, aap_gateway, aap_hub, aap_receptor):
$ sudo sos report --profile ansibleConclusion
The sos report plugin system is one of those tools that quietly becomes indispensable once you start relying on it. Whether you are chasing down a kernel panic, troubleshooting a misbehaving OpenStack deployment, or handing off a support case to Red Hat, knowing how to drive sos effectively — which plugins to enable, which to skip, and which profiles match your situation — can save you significant time and back-and-forth.
With over 400 plugins covering everything from bare-metal hardware diagnostics to container orchestration and SAP workloads, the odds are good that whatever stack you are running, sos already knows what to collect. And when it does not, the plugin architecture is straightforward enough that writing your own is a realistic option.
The key takeaways are simple: default plugins cover most general-purpose diagnostics, profiles give you a shortcut for well-known software stacks, and per-plugin options let you fine-tune collection without resorting to blunt instruments like grabbing everything and hoping for the best. Keep the --only-plugins and --skip-plugins flags in your back pocket — on busy production systems, a targeted sos run is almost always preferable to a full sweep.
If you have not explored the full plugin list yet, it is worth a look. You may be surprised how much ground sos already covers out of the box.