18. Using sos report Presets.

Integration of sos report in Incident Management Pipelines.
Monitoring and observability tools — Grafana, Prometheus, traces, logs — tell you that something is wrong and where. They do not tell you what the host operating system was doing at that moment: which processes were consuming memory, what the kernel OOM killer decided, whether a filesystem was saturated, what the block device queue looked like, what firewall rules were in effect. That data lives on the node, is often ephemeral, and disappears or changes as the system recovers.
The purpose of integrating sos report into the pipeline is to capture that OS-level snapshot automatically, at the moment of the alert, before the evidence degrades without requiring a human to log into the node and collect it manually.
More specifically it achieves four things:
Speed of diagnosis. The data is already collected and analysed by the time the SRE opens the alert. They review findings instead of gathering evidence.
Evidence preservation. Memory state, kernel ring buffer entries, and process tables are ephemeral. Automated collection catches them before the system recovers and overwrites them.
Reduced toil. Manual OS diagnostics during an incident are slow, error-prone, and inconsistent between engineers. Presets make the collection reproducible and automatic.
Completeness. Every incident of the same type produces the same shape of data, making cross-incident comparison and pattern recognition — including by an AI analysis tool meaningful and reliable.
In short: monitoring tells you the what, tracing tells you the where, and sos report presets tell you the why automatically, consistently, and fast enough to be useful during the incident rather than after it.
In the previous article we covered how /etc/sos/sos.conf eliminates the need to repeat long command-line invocations by defining a system-wide default configuration for every sos report run. That mechanism is excellent for establishing a consistent baseline across your fleet — but it applies the same behavior to every execution.
Real-world production environments, however, rarely need the same diagnostic data every time. A disk saturation alert demands completely different information than an OOM kill event or a degraded microservice. Forcing a full-blown sos report in response to every alert is wasteful: it takes longer, generates larger archives, and buries the relevant data under a mountain of unrelated information.
This is exactly the problem that sos report presets are designed to solve and what is covered in this article..
TL;DR
sos report presets are named, reusable configurations stored in
/etc/sos/presets.d/that tellsos reportexactly which plugins to run and which options to apply — triggered with a single--preset <name>flag. In a Kubernetes environment, presets are deployed to worker nodes (not pods) and executed automatically when Grafana fires an alert: Grafana calls a webhook, the webhook triggers an Ansible playbook, the playbook SSHes into the affected node and runssos reportwith the matching preset, and the resulting archive is encrypted and uploaded to sos-vault for AI analysis — all within 20 – 45 seconds.The five presets covered in this article:
Preset
Alert trigger
Key plugins
Est. time
Est. size
diskProblemFilesystem > 85%
or I/O latency spike
filesystem, block, lvm2,
zfs, scsi, cifs, logs
20 – 45 s
3 – 8 MiB
s3UnavailableS3 error rate spike
networking, firewalld,
nftables, dns, logs
20 – 40 s
3 – 7 MiB
databaseUnreachableDB connection timeout
or pool exhaustion
networking, firewalld,
nftables, ulimits, pacemaker,
logs
20 – 40 s
3 – 7 MiB
OOMKilledOOMKilled container
via kube-state-metrics
memory, cgroups, logs
15 – 35 s
2 – 6 MiB
serviceDegradationElevated error rate or
P99 latency
networking, cpu, systemd,
interrupts, ulimits, logs
20 – 45 s
3 – 8 MiB
Every preset also includes
host,kernel,memory,process,release, anddateas a fixed baseline, and caps bothlog-sizeandjournal-sizeat 15 MB to keep archives predictable. For comparison, an unconstrained fullsos reporton the same node takes 3 – 8 minutes and produces 50 – 200 MiB.The minimal JSON structure:
{
  "presetName": {
    "desc": "Short description",
    "note": "Behavioural note",
    "args": {
      "batch": true,
      "log-size": 15,
      "journal-size": 15,
      "only-plugins": "host,kernel,...",
      "encrypt-pass": "ENCRYPTION_PASSWORD",
      "upload-url": "https://sos-vault.com/api/upload",
      "upload-user": "[email protected]",
      "upload-pass": "UPLOAD_PASSWORD",
      "upload-method": "post"
    }
  }
}
Read on for the full pipeline architecture, all five preset definitions, the complete deployable JSON file, and the Ansible playbooks to wire everything together.
Supported distributions
The preset functionality described in this article applies to the following distributions: Red Hat Enterprise Linux, CentOS, Rocky Linux, AlmaLinux, Amazon Linux, Azure Linux (CBL-Mariner), Circle Linux, CloudLinux, Anolis OS, OpenCloudOS, OpenEuler, and UnionTech Server. Custom presets do not work out of the box on Ubuntu, Debian, SUSE, openSUSE, or Google Container-Optimized OS.
Introduction: One Command, Many Faces
A preset is a named, reusable configuration that instructs sos report to behave in a precisely defined way — limiting which plugins run, which options are applied, and how the resulting archive is handled — all without the operator ever having to type a complex command.
When paired with an incident management pipeline, presets become something far more powerful: they turn sos report into a targeted, automated diagnostic probe that can be fired in response to a specific alert, collect only the data relevant to that alert, and ship a compact, encrypted report to an analysis platform — all within seconds.
For DevOps and SRE teams, this means:
Reduced mean time to data (MTTD): Presets are fast because they only run the plugins you need.
Smaller archives: A focused report can be an order of magnitude smaller than a full collection.
Automation-friendly: A preset can be triggered by name with a single command, making it trivial to integrate with Ansible playbooks, Kubernetes operators, or any scripting layer.
Reproducible diagnostics: The same preset produces the same shape of data every time, making cross-incident comparisons meaningful.
This article walks you through everything you need to know to build, deploy, and integrate sos presets into a real Kubernetes production environment.
How Presets Work
Presets are defined in JSON files stored under the /etc/sos/presets.d/ directory. Each file can contain one or more named presets, each specifying a set of options that will be applied when sos report is invoked with the --preset <name> flag.
When sos report runs with a preset:
It loads built-in defaults.
It reads
/etc/sos/sos.conf(if present).It applies the named preset, overriding any matching options from
sos.conf.It applies any command-line flags last (highest priority).
Precedence order:
Command-line options > preset > sos.conf > built-in defaults
This layered model means you can use /etc/sos/sos.conf to define truly global defaults (upload parameters, upload and encryption keys, compression type, temporary directory) and use presets to express the intent of each diagnostic — which plugins to run, which data to upload, and under what constraints — with presets always able to override the baseline when needed.
The Preset JSON File
File Location
Preset files are placed in /etc/sos/presets.d/. Any .json file in this directory is automatically discovered and loaded when sos report starts. Presets are organized into multiple files — one per team, one per application, one per environment or as in this article one per type of alert — .
How the File Is Parsed
It is important to understand the exact structure the sos parser expects. The sos report command reads each JSON file in search of a preset name. Under each preset name, it looks for three specific keys:
JSON key | Purpose |
|---|---|
| Short description shown by |
| Behavioural note shown by |
| A dictionary of sos option names and their values |
Plugin selection is expressed as an entry inside args. Please note that the args key names use underscores in contrast of the dashes that are used in the command line and the sos.conf file — they correspond directly to the regular command line options (e.g. only-plugins, log-size, encrypt-pass, upload-url).
To easily find out what plugins you need for a specific purpose or to retrieve an specific command output, log file or configuration file; there is a plugin finder tool available in this article that allows you to find plugins by name, by included files, by included commands and describes in great detail what each plugin does and what options it supports.
Minimal Structure
{
  "preset-name": {
    "desc": "Short description of this preset",
    "note": "Behavioural note displayed with --list-presets",
    "args": {
      "batch": true,
      "log-size": 15,
      "journal-size": 15,
      "only-plugins": "host,kernel,memory",
      "encrypt-pass": "ENCRYPTION_PASSWORD",
      "upload-url": "https://sos-vault.com/api/upload",
      "upload-user": "[email protected]",
      "upload-pass": "UPLOAD_PASSWORD",
      "upload-method": "post"
    }
  }
}
Minimum Required Fields in Every Preset
Regardless of the alert type, every preset in this guide includes:
Option key | Purpose |
|---|---|
| Suppresses interactive prompts for automated execution |
| Caps the size of each collected log file (MB) |
| Caps the size of the systemd journal collected (MB) — critical for keeping archives predictable; omitting this leaves the default at 100 MB and is the single biggest driver of archive bloat |
| Encrypts the archive before upload |
| Destination endpoint on sos-vault |
| Authentication identity |
| Authentication credential |
| HTTP method used by the uploader |
| Core system context — always included so every report can be correlated to a specific host, kernel, and point in time |
NOTE: As mentioned before options like encrypt_pass, upload_url, upload_user, upload_pass, and upload_method would be better to be defined in the /etc/sos/sos.conf file as they all are general and applicable to all presets however this article defines them in each preset JSON file.
Creating Presets
There are two ways to create presets: using the sos report command itself, or manually editing a JSON file.
Option 1: Using the sos Command
The sos report command can generate preset entries from command-line options. This is convenient for interactive, one-off preset creation, because it validates options before writing:
sudo sos report --add-preset diskProblem \
  --desc "Disk and filesystem diagnostic for storage-related alerts" \
  --note "Triggered by Grafana disk usage alert. Includes filesystem, block, lvm2, and storage plugins." \
  --batch \
  --log-size=15 \
  --journal-size=15 \
  --only-plugins=host,kernel,memory,process,release,date,filesystem,block,cifs,scsi,logs,lvm2,zfs \
  --encrypt-pass="ENCRYPTION_PASSWORD" \
  --upload-url="https://sos-vault.com/api/upload" \
  --upload-user="[email protected]" \
  --upload-pass="UPLOAD_PASSWORD" \
  --upload-method=post
This writes the preset into a JSON file under /etc/sos/presets.d/. The --desc and --note fields are visible when listing presets and serve as inline documentation for your team — always include them.
Option 2: Manual JSON Creation
You can also create the preset file directly. This is the preferred approach when deploying presets at scale via configuration management tools (Ansible, Puppet, Chef) or when building a standard preset library to distribute across a fleet of nodes. Create the file at /etc/sos/presets.d/k8s-production.json.
Listing active presets is straightforward:
sudo sos report --list-presets
A Real-World Scenario: Kubernetes + Grafana + Ansible
To demonstrate how presets deliver real operational value, let us walk through a concrete production environment.
Where sos report Runs in a Kubernetes Environment
Before describing the pipeline, it is worth being precise about one architectural point: sos report runs on the Kubernetes node, not inside a pod.
sos report requires root, is not installed in application container images, and collects data from the host operating system — the physical or virtual machine running the Kubernetes worker. Disk saturation, OOM kills, LVM volume state, block device errors, and kernel ring buffer output are all node-level phenomena, invisible from inside a container's namespaced view. The preset files under /etc/sos/presets.d/ are therefore deployed to every Kubernetes worker node, not to pods.
When Grafana fires an alert about a pod — say, an OOMKilled event — the pipeline must identify which node that pod was scheduled on and run sos report on that node. The Kubernetes API makes this trivial: every pod's status includes a nodeName field that names the worker it landed on.
The setup:
A Kubernetes cluster running multiple production workloads.
Grafana for metrics collection, dashboarding, and alert management.
Ansible for agentless SSH-based remote command execution across cluster nodes.
sos-vault 2.0.0 as the central repository for diagnostic archives, with its built-in AI analysis engine to automatically parse incoming reports and surface findings.
The Pipeline
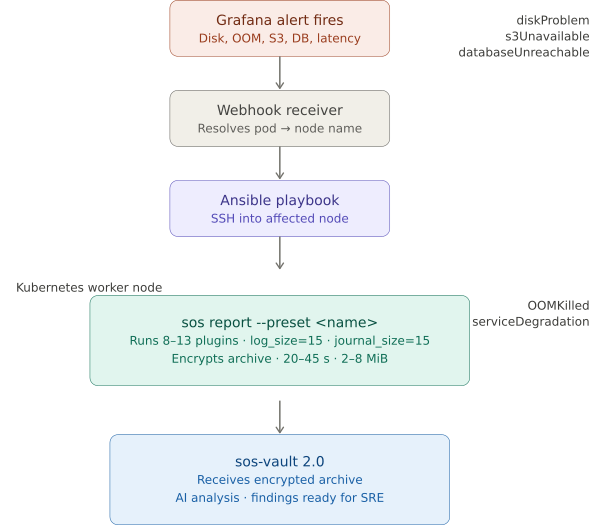
Step 1: Deploy Presets to Every Worker Node
Use Ansible itself to distribute the preset file to every node in the cluster, ensuring it is in place before any alert fires:
- name: Deploy sos report presets to all Kubernetes nodes
  hosts: k8s_workers
  become: true
  tasks:
    - name: Ensure presets directory exists
      file:
        path: /etc/sos/presets.d
        state: directory
        mode: '0755'

    - name: Deploy k8s-production preset file
      copy:
        src: files/k8s-production.json
        dest: /etc/sos/presets.d/k8s-production.json
        owner: root
        group: root
        mode: '0600'
Step 2: Write a Playbook Per Preset
Each alert type maps to a short playbook. The playbook receives the affected node's hostname and case ID as variables — both supplied by the Grafana webhook:
# playbooks/sos-disk-problem.yml
- name: Run diskProblem sos report on affected node
  hosts: "{{ target_node }}"
  become: true
  tasks:
    - name: Execute sos report with diskProblem preset
      command: >
        sos report
        --preset diskProblem
        --case-id="{{ case_id }}"
      async: 300
      poll: 10
Invoke it from the webhook handler:
ansible-playbook playbooks/sos-disk-problem.yml \
  -e "target_node=worker-node-03 case_id=INC-20240517-001"
Step 3: Configure Grafana to Fire the Webhook
In Grafana, configure a contact point of type Webhook. Point it at a lightweight webhook receiver (a small Flask or FastAPI service, or a serverless function) that extracts the alert labels, queries the Kubernetes API for the pod's nodeName, and invokes the correct Ansible playbook.
A minimal webhook handler in Python illustrates the logic:
from flask import Flask, request
import subprocess, json

app = Flask(__name__)

PRESET_MAP = {
    "DiskUsageHigh":         "sos-disk-problem.yml",
    "S3ErrorRateHigh":       "sos-s3-unavailable.yml",
    "DBConnectionTimeout":   "sos-database-unreachable.yml",
    "OOMKilled":             "sos-oom-killed.yml",
    "ServiceLatencyHigh":    "sos-service-degradation.yml",
}

@app.route("/grafana-alert", methods=["POST"])
def handle_alert():
    payload  = request.json
    alert    = payload["alerts"][0]
    rule     = alert["labels"]["alertname"]
    pod      = alert["labels"].get("pod", "")
    case_id  = alert["fingerprint"]

    # Resolve the node name from the Kubernetes API
    node = get_node_for_pod(pod)
    playbook = PRESET_MAP.get(rule)

    if playbook and node:
        subprocess.Popen([
            "ansible-playbook", f"playbooks/{playbook}",
            "-e", f"target_node={node} case_id={case_id}"
        ])

    return "", 200
Step 4: Let sos-vault Do the Rest
Once sos report completes on the node, the archive is encrypted, uploaded, and waiting in sos-vault. The sos-vault 2.0.0 AI analysis engine immediately begins processing the report, running automated checks across all collected data: it correlates disk usage metrics with LVM volume group state, checks for filesystem errors in the kernel ring buffer, identifies which processes are the top consumers of the saturated path, and surfaces findings in a structured incident view.
By the time the on-call SRE opens the alert, the diagnostic cycle is already done. The SRE does not collect data — they review data. That shift is the real value of this pipeline.
The Five Presets
The following presets cover the five most common alert categories in this environment. All five are deployed to every worker node via the Ansible playbook above.
Preset 1: diskProblem
Alert trigger: Grafana detects filesystem usage above 85% or a sharp spike in disk I/O latency.
Goal: Collect everything needed to understand the storage layer on the affected node — which filesystems are full, which logical volumes are involved, which block devices are saturated, and what the system logs say about it.
Plugins included: host, kernel, memory, process, release, date, filesystem, block, cifs, scsi, logs, lvm2, zfs
Creating the preset:
sudo sos report --add-preset diskProblem \
  --desc "Disk and filesystem diagnostic for storage saturation alerts" \
  --note "Triggered by Grafana: filesystem_usage > 85% or disk I/O latency spike. Covers block, lvm2, zfs, cifs, scsi, and filesystem layers." \
  --batch \
  --log-size=15 \
  --journal-size=15 \
  --only-plugins=host,kernel,memory,process,release,date,filesystem,block,cifs,scsi,logs,lvm2,zfs \
  --encrypt-pass="ENCRYPTION_PASSWORD" \
  --upload-url="https://sos-vault.com/api/upload" \
  --upload-user="[email protected]" \
  --upload-pass="UPLOAD_PASSWORD" \
  --upload-method=post
JSON definition:
{
  "diskProblem": {
    "desc": "Disk and filesystem diagnostic for storage saturation alerts",
    "note": "Triggered by Grafana: filesystem_usage > 85% or disk I/O latency spike.",
    "args": {
      "batch": true,
      "log-size": 15,
      "journal-size": 15,
      "only-plugins": "host,kernel,memory,process,release,date,filesystem,block,cifs,scsi,logs,lvm2,zfs",
      "encrypt-pass": "ENCRYPTION_PASSWORD",
      "upload-url": "https://sos-vault.com/api/upload",
      "upload-user": "[email protected]",
      "upload-pass": "UPLOAD_PASSWORD",
      "upload-method": "post"
    }
  }
}
Ansible invocation:
ansible-playbook playbooks/sos-disk-problem.yml \
  -e "target_node=worker-node-03 case_id=INC-20240517-001"
Preset 2: s3Unavailable
Alert trigger: Grafana detects S3 API errors above a threshold — connection timeouts, HTTP 5xx responses, or bucket access failures from application pods.
Goal: Understand the network path between the node and the S3 endpoint. Capture DNS resolution behavior, firewall rules, active connections, and any routing anomalies at the node level.
Plugins included: host, kernel, memory, process, release, date, networking, firewalld, nftables, dns, logs
Creating the preset:
sudo sos report --add-preset s3Unavailable \
  --desc "Network and DNS diagnostic for S3 connectivity failures" \
  --note "Triggered by Grafana: S3 error rate spike. Covers networking stack, DNS resolution, firewall rules, and active connections." \
  --batch \
  --log-size=15 \
  --journal-size=15 \
  --only-plugins=host,kernel,memory,process,release,date,networking,firewalld,nftables,dns,logs \
  --encrypt-pass="ENCRYPTION_PASSWORD" \
  --upload-url="https://sos-vault.com/api/upload" \
  --upload-user="[email protected]" \
  --upload-pass="UPLOAD_PASSWORD" \
  --upload-method=post
JSON definition:
{
  "s3Unavailable": {
    "desc": "Network and DNS diagnostic for S3 connectivity failures",
    "note": "Triggered by Grafana: S3 error rate spike.",
    "args": {
      "batch": true,
      "log-size": 15,
      "journal-size": 15,
      "only-plugins": "host,kernel,memory,process,release,date,networking,firewalld,nftables,dns,logs",
      "encrypt-pass": "ENCRYPTION_PASSWORD",
      "upload-url": "https://sos-vault.com/api/upload",
      "upload-user": "[email protected]",
      "upload-pass": "UPLOAD_PASSWORD",
      "upload-method": "post"
    }
  }
}
Ansible invocation:
ansible-playbook playbooks/sos-s3-unavailable.yml \
  -e "target_node=worker-node-07 case_id=INC-20240517-002"
Preset 3: databaseUnreachable
Alert trigger: Grafana detects database connection pool exhaustion, query timeouts exceeding SLA thresholds, or complete loss of connectivity to the database endpoint.
Goal: Capture the full picture around database reachability at the OS level — network routes, socket state, and resource limits. This preset deliberately avoids database-internal plugins (which would require credentials and could be slow) and focuses on what the node itself can tell you about why the database cannot be reached.
Plugins included: host, kernel, memory, process, release, date, networking, firewalld, nftables, ulimits, logs, pacemaker
Creating the preset:
sudo sos report --add-preset databaseUnreachable \
  --desc "OS-level diagnostic for database connectivity failures" \
  --note "Triggered by Grafana: DB connection timeout or pool exhaustion. Focuses on network, socket state, resource limits, and system logs." \
  --batch \
  --log-size=15 \
  --journal-size=15 \
  --only-plugins=host,kernel,memory,process,release,date,networking,firewalld,nftables,ulimits,logs,pacemaker \
  --encrypt-pass="ENCRYPTION_PASSWORD" \
  --upload-url="https://sos-vault.com/api/upload" \
  --upload-user="[email protected]" \
  --upload-pass="UPLOAD_PASSWORD" \
  --upload-method=post
JSON definition:
{
  "databaseUnreachable": {
    "desc": "OS-level diagnostic for database connectivity failures",
    "note": "Triggered by Grafana: DB connection timeout or pool exhaustion.",
    "args": {
      "batch": true,
      "log-size": 15,
      "journal-size": 15,
      "only-plugins": "host,kernel,memory,process,release,date,networking,firewalld,nftables,ulimits,logs,pacemaker",
      "encrypt-pass": "ENCRYPTION_PASSWORD",
      "upload-url": "https://sos-vault.com/api/upload",
      "upload-user": "[email protected]",
      "upload-pass": "UPLOAD_PASSWORD",
      "upload-method": "post"
    }
  }
}
Ansible invocation:
ansible-playbook playbooks/sos-database-unreachable.yml \
  -e "target_node=worker-node-02 case_id=INC-20240517-003"
Preset 4: OOMKilled
Alert trigger: Grafana detects an OOMKilled event via kube-state-metrics (kube_pod_container_status_last_terminated_reason == "OOMKilled").
Goal: This is a node-level memory pressure event. The data needed is precise: current memory allocation on the node, cgroup memory limits, kernel OOM kill logs, and page reclaim activity. Speed matters here because the memory state is ephemeral — you want the report collected on the node as close to the event as possible.
Plugins included: host, kernel, memory, process, release, date, cgroups, logs
Creating the preset:
sudo sos report --add-preset OOMKilled \
  --desc "Memory pressure and OOM kill diagnostic" \
  --note "Triggered by Grafana: OOMKilled container detected via kube-state-metrics. Captures node-level cgroup limits, memory state, and OOM kernel logs." \
  --batch \
  --log-size=15 \
  --journal-size=15 \
  --only-plugins=host,kernel,memory,process,release,date,cgroups,logs \
  --encrypt-pass="ENCRYPTION_PASSWORD" \
  --upload-url="https://sos-vault.com/api/upload" \
  --upload-user="[email protected]" \
  --upload-pass="UPLOAD_PASSWORD" \
  --upload-method=post
JSON definition:
{
  "OOMKilled": {
    "desc": "Memory pressure and OOM kill diagnostic",
    "note": "Triggered by Grafana: OOMKilled container. Captures node-level cgroup limits, memory state, and OOM kernel logs.",
    "args": {
      "batch": true,
      "log-size": 15,
      "journal-size": 15,
      "only-plugins": "host,kernel,memory,process,release,date,cgroups,logs",
      "encrypt-pass": "ENCRYPTION_PASSWORD",
      "upload-url": "https://sos-vault.com/api/upload",
      "upload-user": "[email protected]",
      "upload-pass": "UPLOAD_PASSWORD",
      "upload-method": "post"
    }
  }
}
Ansible invocation:
ansible-playbook playbooks/sos-oom-killed.yml \
  -e "target_node=worker-node-05 case_id=INC-20240517-004"
Preset 5: serviceDegradation
Alert trigger: Grafana detects elevated error rates, increased P99 latency, or reduced throughput on a service endpoint — without a clear single root cause.
Goal: Cast a wider net at the node level. Capture CPU scheduling, interrupt pressure, network throughput, and service logs. This preset runs more plugins than the others but remains scoped — no storage collection, no database layers.
Plugins included: host, kernel, memory, process, release, date, networking, cpu, systemd, logs, interrupts, ulimits
Creating the preset:
sudo sos report --add-preset serviceDegradation \
  --desc "Broad system diagnostic for unexplained service degradation" \
  --note "Triggered by Grafana: elevated error rate or latency spike without clear root cause. Covers CPU, networking, systemd, and interrupt pressure." \
  --batch \
  --log-size=15 \
  --journal-size=15 \
  --only-plugins=host,kernel,memory,process,release,date,networking,cpu,systemd,logs,interrupts,ulimits \
  --encrypt-pass="ENCRYPTION_PASSWORD" \
  --upload-url="https://sos-vault.com/api/upload" \
  --upload-user="[email protected]" \
  --upload-pass="UPLOAD_PASSWORD" \
  --upload-method=post
JSON definition:
{
  "serviceDegradation": {
    "desc": "Broad system diagnostic for unexplained service degradation",
    "note": "Triggered by Grafana: elevated error rate or P99 latency spike.",
    "args": {
      "batch": true,
      "log-size": 15,
      "journal-size": 15,
      "only-plugins": "host,kernel,memory,process,release,date,networking,cpu,systemd,logs,interrupts,ulimits",
      "encrypt-pass": "ENCRYPTION_PASSWORD",
      "upload-url": "https://sos-vault.com/api/upload",
      "upload-user": "[email protected]",
      "upload-pass": "UPLOAD_PASSWORD",
      "upload-method": "post"
    }
  }
}
Ansible invocation:
ansible-playbook playbooks/sos-service-degradation.yml \
  -e "target_node=worker-node-01 case_id=INC-20240517-005"
Estimated Execution Time and Archive Size
One of the most common questions about integrating sos report into an incident pipeline is: how much overhead does this actually add? The table below provides realistic estimates grounded in measured data from a real system.
Methodology
The estimates below are derived from benchmarks run on an 8-core, 16 GB RAM workstation at 1% CPU load using sos 4.9.0 on Ubuntu 22.04. The key findings from that dataset are:
A full sos report (81 plugins,
log-size=10,journal-size=10) completed in ~31 seconds and produced an ~9 MiB encrypted archive.A focused 9-plugin run with the same log limits completed in ~15 seconds and produced a ~2.8 MiB archive.
The dominant insight: execution time is driven by a fixed startup/teardown/compression overhead of roughly 15 seconds, not by plugin count. Going from 9 to 81 plugins only adds another 15 seconds. Plugin count is therefore a minor factor in time but a more significant factor in archive size.
The journal is the biggest wildcard for size. Without an explicit
journal_sizecap, the default is 100 MiB. A busy production node generating verbose logs can push archive size from 3 MiB to 50+ MiB in seconds. This is why every preset in this guide explicitly setsjournal_size: 15.
Production Kubernetes worker nodes will be slower and produce larger archives than the benchmark workstation: they carry heavier logs, more running processes, larger filesystem tables, and busier network state. The estimates below apply a conservative multiplier to account for this.
Estimates Per Preset
Preset | Plugins | Est. execution time | Est. archive size |
|---|---|---|---|
| 13 | 20 – 45 s | 3 – 8 MiB |
| 11 | 20 – 40 s | 3 – 7 MiB |
| 12 | 20 – 40 s | 3 – 7 MiB |
| 8 | 15 – 35 s | 2 – 6 MiB |
| 12 | 20 – 45 s | 3 – 8 MiB |
For comparison: an unconstrained full sos report on the same production node would typically take 3 – 8 minutes and produce a 50 – 200 MiB archive.
What Pushes Numbers Higher
The upper end of the ranges above applies when: the node has been running for weeks without a log rotation, the logs plugin finds many large files in /var/log, systemd has a dense journal, or the filesystem plugin is iterating a large number of mount points. The diskProblem preset is the most likely to hit the upper end of both time and size, precisely because it includes the filesystem and block device layers that are active during a disk saturation event.
What Keeps Numbers Lower
A recently recycled node, a quiet log directory, or a node with a read-only root filesystem (common in some Kubernetes distributions) will produce reports toward the lower end. The OOMKilled preset is the leanest by design: it targets memory state that must be captured immediately, so it deliberately includes the minimum number of plugins.
All preset in a Single Preset File
It is also possible to group several preset in a single JSON file, deployed to every worker node in the cluster via the Ansible distribution playbook shown earlier:
{
  "diskProblem": {
    "desc": "Disk and filesystem diagnostic for storage saturation alerts",
    "note": "Triggered by Grafana: filesystem_usage > 85% or disk I/O latency spike.",
    "args": {
      "batch": true,
      "log-size": 15,
      "journal-size": 15,
      "only-plugins": "host,kernel,memory,process,release,date,filesystem,block,cifs,scsi,logs,lvm2,zfs",
      "encrypt-pass": "ENCRYPTION_PASSWORD",
      "upload-url": "https://sos-vault.com/api/upload",
      "upload-user": "[email protected]",
      "upload-pass": "UPLOAD_PASSWORD",
      "upload-method": "post"
    }
  },
  "s3Unavailable": {
    "desc": "Network and DNS diagnostic for S3 connectivity failures",
    "note": "Triggered by Grafana: S3 error rate spike.",
    "args": {
      "batch": true,
      "log-size": 15,
      "journal-size": 15,
      "only-plugins": "host,kernel,memory,process,release,date,networking,firewalld,nftables,dns,logs",
      "encrypt-pass": "ENCRYPTION_PASSWORD",
      "upload-url": "https://sos-vault.com/api/upload",
      "upload-user": "[email protected]",
      "upload-pass": "UPLOAD_PASSWORD",
      "upload-method": "post"
    }
  },
  "databaseUnreachable": {
    "desc": "OS-level diagnostic for database connectivity failures",
    "note": "Triggered by Grafana: DB connection timeout or pool exhaustion.",
    "args": {
      "batch": true,
      "log-size": 15,
      "journal-size": 15,
      "only-plugins": "host,kernel,memory,process,release,date,networking,firewalld,nftables,ulimits,logs,pacemaker",
      "encrypt-pass": "ENCRYPTION_PASSWORD",
      "upload-url": "https://sos-vault.com/api/upload",
      "upload-user": "[email protected]",
      "upload-pass": "UPLOAD_PASSWORD",
      "upload-method": "post"
    }
  },
  "OOMKilled": {
    "desc": "Memory pressure and OOM kill diagnostic",
    "note": "Triggered by Grafana: OOMKilled container detected via kube-state-metrics.",
    "args": {
      "batch": true,
      "log-size": 15,
      "journal-size": 15,
      "only-plugins": "host,kernel,memory,process,release,date,cgroups,logs",
      "encrypt-pass": "ENCRYPTION_PASSWORD",
      "upload-url": "https://sos-vault.com/api/upload",
      "upload-user": "[email protected]",
      "upload-pass": "UPLOAD_PASSWORD",
      "upload-method": "post"
    }
  },
  "serviceDegradation": {
    "desc": "Broad system diagnostic for unexplained service degradation",
    "note": "Triggered by Grafana: elevated error rate or P99 latency spike.",
    "args": {
      "batch": true,
      "log-size": 15,
      "journal-size": 15,
      "only-plugins": "host,kernel,memory,process,release,date,networking,cpu,systemd,logs,interrupts,ulimits",
      "encrypt-pass": "ENCRYPTION_PASSWORD",
      "upload-url": "https://sos-vault.com/api/upload",
      "upload-user": "[email protected]",
      "upload-pass": "UPLOAD_PASSWORD",
      "upload-method": "post"
    }
  }
}
Practical Considerations
Security: Preset files contain encryption passwords and upload credentials. Restrict access on every node with:
chmod 600 /etc/sos/presets.d/k8s-production.json
chown root:root /etc/sos/presets.d/k8s-production.json
Manage the actual secret values via your secrets management solution (Vault, AWS Secrets Manager, Kubernetes Secrets). The JSON file distributed by Ansible should contain placeholders that are substituted at deploy time using Ansible Vault or a lookup plugin.
Plugin availability: Not every plugin exists on every distribution or kernel version. Run sudo sos report --list-plugins on a representative node to verify that all plugins referenced in your presets are available before distributing the preset file.
Preset versioning: Treat preset files as code. Store them in version control alongside the Ansible playbooks, review changes in pull requests, and tag releases. A preset change is a change to your incident response behavior — it deserves the same rigor as a change to an alert rule.
Node SSH access: sos report requires SSH access to the Kubernetes worker nodes. In managed Kubernetes services (GKE, EKS, AKS), node SSH is possible but may require additional configuration such as OS login, bastion hosts, or AWS Systems Manager Session Manager as a transport. Confirm your node access method before integrating this pipeline.
Iterating on presets: After each incident, review what data the preset collected and what was missing. Update the plugin list accordingly. Presets should evolve with your understanding of your system.
Summary
Presets transform sos report from a general-purpose diagnostic tool into a precision instrument.
By defining a small library of focused, named configurations — one per alert category — and deploying them uniformly across every Kubernetes worker node, you gain:
Speed: Only the relevant plugins run. Focused reports complete in 20 – 45 seconds on a production node — compared to 3 – 8 minutes for a full unconstrained collection.
Size: Archives stay in the 2 – 8 MiB range per incident — compared to 50 – 200 MiB for a full report. Smaller archives mean faster uploads, lower storage costs, and faster AI analysis turnaround.
Automation: A single
--preset <name>flag is all an Ansible playbook needs to produce a complete, encrypted, uploaded diagnostic from the affected node.Consistency: Every
diskProblemreport has the same shape. EveryOOMKilledreport contains the same data. Cross-incident comparison becomes meaningful.AI readiness: When reports are structured and scoped, the sos-vault 2.0.0 AI analysis engine can parse them faster and produce higher-confidence findings — because there is no noise to filter through.
Presets, combined with /etc/sos/sos.conf for shared defaults, give you a complete configuration strategy for sos report: a system-wide baseline that handles the boilerplate, and a per-alert library that handles the intent.
The result is a diagnostic pipeline that works while your team sleeps — collecting the right data, from the right node, at the right moment, and delivering it to sos-vault before the on-call engineer has finished reading the alert notification.